Key takeaways
- Most store chats happen when the support team is offline – evenings are as busy as office hours.
- Storefront chat is mostly a sales channel: shoppers ask for advice before they buy, not about orders after.
- The support inbox is the opposite – mostly post-purchase questions, which are harder to close without a person.
- A chat that recommends products moves shoppers into the cart, and on stores with purchase tracking, on to an order.
- Every figure here comes with its range – results differ a lot from store to store, so the median is the honest “typical”.
AI chatbot statistics for e-commerce: the key numbers
The figures below are for the median store – the one in the middle of the group – with the range across all stores in brackets. Data: 27 September – 26 October 2026.
- 61% of chats arrive outside Monday–Friday, 9:00–17:00 (52–78%).
- An average evening hour (17:00–24:00) brings as many chats as an average office hour.
- 23% of chats arrive at the weekend (15–30%).
- 74% of chats are pre-purchase questions – product advice, specs, delivery terms (47–93%).
- 77% of chats are resolved by the AI with no human (63–93%); across all 205,000+ chats it’s 72%.
- 20% of chats end with an item added to the cart (13–36%).
- 10% of chats end in a purchase (3–19%, on stores that track purchases).
- 47% of shoppers who are shown products in chat click one (28–59%).
- A chat runs to 8.3 messages, shopper and agent together (6.8–10.6).
- 6% of chats ask to speak to a person (0–22%).
- 66% of support emails are post-purchase – orders, returns, complaints.
- 33% of support emails are resolved automatically – and more than half on the best-performing stores.
- More than half of the stores run the same chat agent on several country storefronts – up to 9.
Where the data comes from
Every conversation here was handled by an AskSpot agent: the AI Chat Agent that answers shoppers on the storefront, or the AI Inbox Agent that replies to support emails. We took our largest clients – together about three-quarters of all our chat volume – and pulled every conversation whose last message fell between 27 September and 26 October 2026.
- Chat: 205,731 conversations. Inbox: 52,199 support emails (medians count only stores with more than 100 emails in the month).
- Who: mid-size and large European retailers in electronics, sports, car and motorbike parts, fashion, health, home and garden, baby products, coffee, outdoor gear and a multi-country marketplace, with storefronts in 21 countries.
- Cleaned: test chats, staging sites and our own panel previews removed.
- Time: the shopper’s local time, from the first message.
We report the median store rather than one pooled average because the biggest stores would otherwise drown out the rest – a single marketplace makes up a third of the chats. Where the pooled figure across all conversations says something different, we give it too.
When shoppers chat: 6 in 10 conversations fall outside office hours
On the median store, 61% of chats start outside Monday–Friday, 9:00–17:00. Not one store in the group was below half – the lowest was 52%, the highest 78%. Weekday evenings alone account for about a third of all chats, weekends for close to a quarter, and the hours between midnight and 9:00 for around one in ten.
The shape matters more than the total. Chat volume peaks around lunchtime, but it doesn’t fall away at 17:00 – it holds at roughly the same level until 23:00. An average hour between 17:00 and midnight brings as many chats as an average hour of the working day. Monday is the busiest day (17% of the week), Saturday the quietest (10.5%), and Sunday picks up again (12%) as people plan the week’s shopping.
61%
of chats arrive outside Mon–Fri 9–17
AskSpot Internal Data
32%
arrive on weekday evenings, 17–24
AskSpot Internal Data
23%
arrive at the weekend
AskSpot Internal Data
Support email follows office hours more closely: on the median store 53% of emails come in outside 9–17 and 16% at the weekend, and daytime hours are clearly busier than evenings. People write an email when something needs sorting; they open a chat when they’re browsing – and most browsing happens after work. Our after-hours analysis, which combines chat and email, puts the overall share at 56%; for chat on its own, the median store this month sits at 61%.
What shoppers ask an e-commerce chatbot
Storefront chat is mainly a sales conversation. On the median store, 74% of chats are pre-purchase – the shopper hasn’t bought yet and wants help deciding. Post-purchase questions (where’s my order, how do I return this) make up 16%, though on a few stores the share rises above 40%. A chat can cover more than one topic, so the shares below don’t add up to 100%.
| Topic in chat | Median store | Range |
|---|---|---|
| Finding a product and advice – “which one should I buy?” | 28% | up to 39% |
| Specs and product features | 25% | up to 39% |
| Purchase and delivery terms | 10% | up to 27% |
| Asking for a person | 6% | 0–22% |
| Order status | 5% | up to 30% |
| Compatibility and fit – “will it fit my car?” | 5% | up to 36% |
| Out-of-stock products | 5% | up to 8% |
| Discount codes | 3% | up to 13% |
| Returns | 2% | up to 10% |
| Complaints | 2% | up to 7% |
The mix follows the catalogue. Compatibility questions are a footnote for most stores but run up to a third of chats on car and motorbike parts stores; order status is marginal on most stores and close to a third of chats on others. Shoppers also talk rather than type more often than you might expect: about 1 in 35 chats includes a voice message, on every store in the group.
The support inbox is the mirror image. On the stores that tag emails the same way, 66% of emails are post-purchase: complaints (9%), returns (8%), order status (7%), invoices (6%), cancellations (5%) and courier problems (5%) lead the list. That is the work behind “where is my order?” – and the reason chat and inbox need different agents.
How many conversations AI resolves
On the median store, the AI resolves 77% of chats with no human, and every store in the group is above 60% – the range runs from 63% to 93%. Across all 205,000+ chats, 72% end resolved. “Resolved” here is the strict measure: the conversation actually reached an answer, as marked in the dashboard – not every chat the bot handled before the shopper gave up. We explain why that difference matters in deflection rate vs resolution rate.
Email is harder. On the median store 33% of support emails are resolved automatically, and on the best-performing stores it is more than half. The gap with chat has a reason: a pre-purchase chat question can almost always be answered from the catalogue, while a complaint or a damaged parcel often needs a decision only the store can make. How far an inbox agent goes depends on what the store connects it to (order data, returns, cancellations) and which cases it’s allowed to close on its own.
Be wary of a single “AI resolves 98%” figure. On real stores the honest range for chat is 63–93%, and email varies even more – it depends on the store’s catalogue, data and rules as much as on the AI.
Does an AI chatbot sell? Cart, purchase and click rates
When the chat recommends products, shoppers act on them. On the median store, 20% of chats end with an item in the cart (13–36%), and on stores that track orders back to the chat, 10% end in a purchase (3–19%). Of the shoppers who are shown products in the chat, 47% click at least one. Counted per conversation, not per product card – a shopper shown three options who opens one is a hit, not two misses.
20%
of chats add an item to the cart
AskSpot Internal Data
10%
of chats end in a purchase
AskSpot Internal Data
47%
of shoppers shown products click one
AskSpot Internal Data
These are real consultations, not one-line FAQ lookups: a chat runs to 8.3 messages on the median store, shopper and agent together – about four questions from the shopper, each answered with the store’s own products, prices and stock. A typical exchange looks like this:
 spot
See these numbers on your own store
Book a short demo – we’ll show AskSpot answering questions about your products.
One caveat on purchases: the rate counts orders the store’s own analytics links back to a chat. Stores that don’t track it are left out of the purchase figure rather than counted as zero.
Chat vs support email at a glance
| Median store | Storefront chat | Support email |
|---|---|---|
| Main topic | Pre-purchase (74%) | Post-purchase (66%) |
| Resolved by AI, no human | 77% | 33% |
| Outside Mon–Fri 9–17 | 61% | 53% |
| At the weekend | 23% | 16% |
| Messages per conversation | 8.3 | 1.9 |
Languages and markets
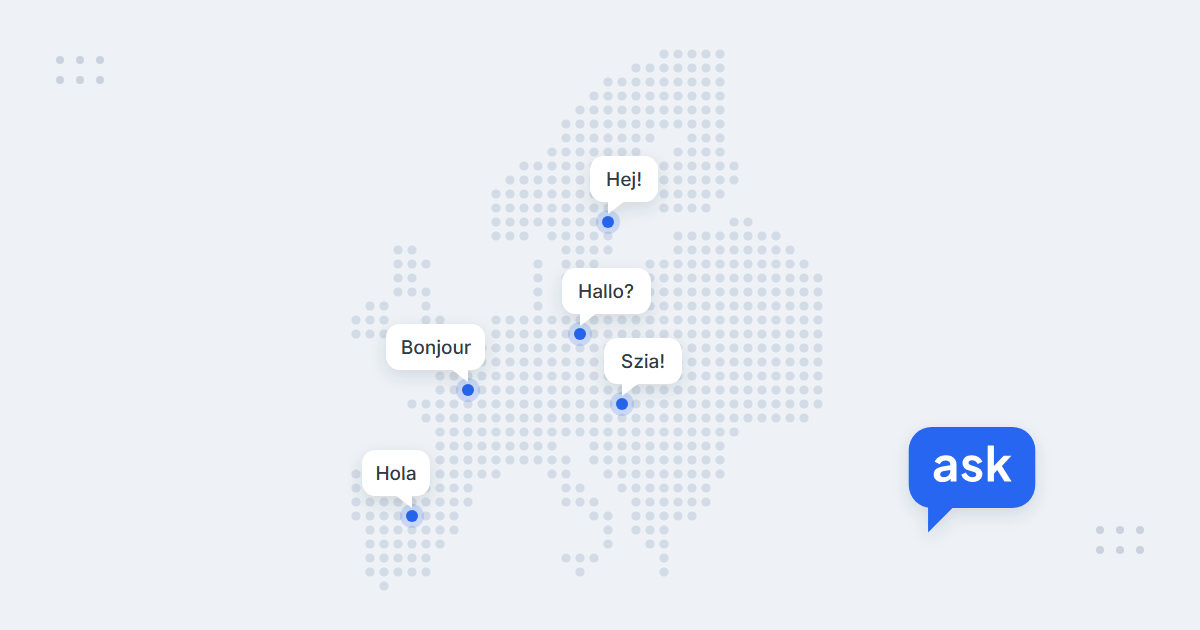
Cross-border selling is the norm, not the exception: More than half of the stores run the same chat agent on several country storefronts, four of them on 8 or 9. Across the group, chats came from storefronts in 21 countries. The agent answers in the shopper’s language – AskSpot supports more than 200 – so a store adding a new market doesn’t need a new support team to go with it. More on that in selling across Europe.
AI in e-commerce: statistics from other sources
The numbers above are our own. For the wider market, these are the most useful recent figures from primary research – note that the Adobe data covers the US only.
- +393%: growth in traffic to US retail sites from generative AI tools, Q1 2026 vs Q1 2025. In March 2026 those visits converted 42% better than other traffic (Adobe Analytics, April 2026).
- 39% of US consumers have used AI for online shopping, and 85% of them say it improved the experience (Adobe survey of 5,000+ consumers, April 2026).
- 20% of global orders during Cyber Week 2025 were influenced by AI and agents – product recommendations and conversational service – worth $67 billion (Salesforce Shopping Index, December 2025).
- 74% of consumers say that because of AI they now expect customer service to be available 24/7 (Zendesk CX Trends 2026).
- 54% of customers trust a human agent more than AI for product recommendations; 32% trust AI more – a good reason to keep a clean handover to your team (Gartner, April 2026).
- 80% of common customer service issues will be resolved autonomously by agentic AI by 2029 – a forecast, not a measurement (Gartner, March 2025).
- 70.22% is the average documented cart abandonment rate across 50 studies – a long-standing benchmark rather than new data (Baymard Institute).
Frequently asked questions
What percentage of e-commerce chats can AI resolve?
Across the stores we analysed, the median store had 77% of chats resolved by the AI with no human, with a range of 63% to 93%. Across all 205,000+ chats it was 72%. Support email is lower: 33% on the median store.
When do online shoppers use chat?
Mostly outside office hours: 61% of chats on the median store start outside Monday–Friday 9:00–17:00. About a third arrive on weekday evenings and close to a quarter at the weekend. An average evening hour is as busy as an average office hour.
Does an AI chatbot increase sales in an online store?
In our data, 20% of chats on the median store end with an item added to the cart and 10% end in a purchase, on stores that track orders back to the chat. 47% of shoppers shown products in the chat click one.
What do shoppers ask an e-commerce chatbot?
Mostly pre-purchase questions: 74% of chats on the median store. The most common are help finding the right product, specs and product features, and purchase and delivery terms. Post-purchase questions dominate support email instead.
How many customer service emails can AI answer automatically?
On the median store, 33% of support emails were resolved automatically, and more than half on the best-performing stores. Results depend on which order, return and cancellation data the agent can use, and which cases the store lets it close.
Methodology and how to cite these statistics
- Period: conversations whose last message fell between 27 September and 26 October 2026. Two weekdays occurred five times in that window, so the timing figures are weighted to a standard week.
- Median store: each store’s rate is calculated first, then the middle value is taken. “All chats” figures pool every conversation instead.
- Resolved: the conversation status in the AskSpot dashboard, which marks whether the shopper’s question was actually resolved – not every conversation the AI handled.
- Cart and purchase: a chat counts once if the shopper added an item or placed an order after it; purchase only on stores that track orders back to the chat.
- Topics: the agent’s own topic tags; a chat can carry several. Email topics come from the stores that use the same tag set.
You’re welcome to use these figures – please cite them as: AskSpot, “AI chatbot statistics for e-commerce (2026)”, askspot.io/blog/ai-chatbot-statistics/, with a link to this page.
To see how these numbers play out on a single store, browse our case studies.